Economics & Macro
 Lite
Lite
Fluctuations in Indonesia's PM2.5 Pollutant Levels Over the Last Three Decades

Erlina Fury Santika
15/07/2024 18:06
WIB

Memuat...
The SOGA report compiles the volume of PM2.5 pollutants in Indonesia over the last three decades. On average, it falls into the moderate level.

- A Font Kecil
- A Font Sedang
- A Font Besar
Access single data
Fluctuations in Indonesia's PM2.5 Pollutant Levels Over the Last Three Decades
Want to get more access to Data Stories with a more affordable price? Subscribe.
By subscribing, you join us in presenting quality data.
Get:
- Premium Data Stories access
- Comfortable reading without ads
- Download data in XLS, PDF, and image format
- Access to data source information
Basic
Rp100.000
Rp50.000/month
Professional
Rp100.000
Rp150.000/month
Institutional
For organizations
We accept the following payments:

Related Data


Latest Data Stories
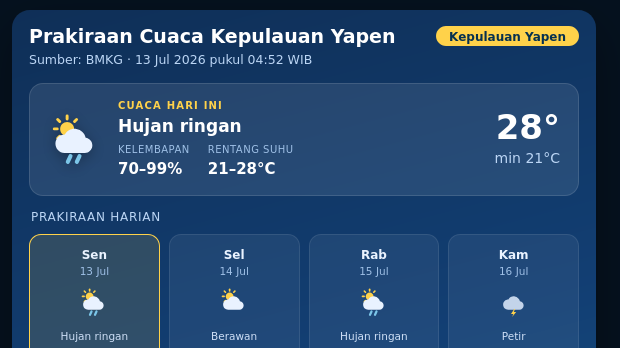

Banten Night Air Quality (12/7): Worst in Indonesia
Consumer Services & Health
12/07/2026, 19:44
WIB

Statistics of Slaughter-Ready Male Beef Cattle Population Period 2013-2025
Demographics
12/07/2026, 17:15
WIB
Market Data
Macro update by
12 July 2026
| Name | Value | % | |
|---|---|---|---|
| Inflasi yoy (Jun) | 3,34% | +0.26 | |
| Inflasi mom (Jun) | 0,44% | +0.16 | |
| Economic growth | 5,11% | +0.08 | |
| Pertumbuhan ekonomi (yoy) (Q1) | 5,61% | +4.08 | |
| Persentase kemiskinan (Des) | 7,50% | -0.75 | |
| Gini rasio (Sem2) | 0,38 | 0.00 | |
| Nilai Tukar USDIDR | 18.059 | -0.09 | |
| PDB ADHK (Q1) | 3.447,70 | -0.77 | |
| Ekspor Migas (Mei) | 758,10 | -34.38 | |
| Neraca perdagangan (Mei) | -1,61 | -1,907.18 | |
| Impor Migas (Mei) | 4,51 | -1.82 | |
| Ekspor (Mei) | 23,20 | -8.30 | |
| Impor (Mei) | 24,81 | -1.59 | |
| Kunjungan Wisman (Mei) | 1,38 | +10.69 | |
| NTP (Jun) | 114,65 | +0.76 |
Popular Data
