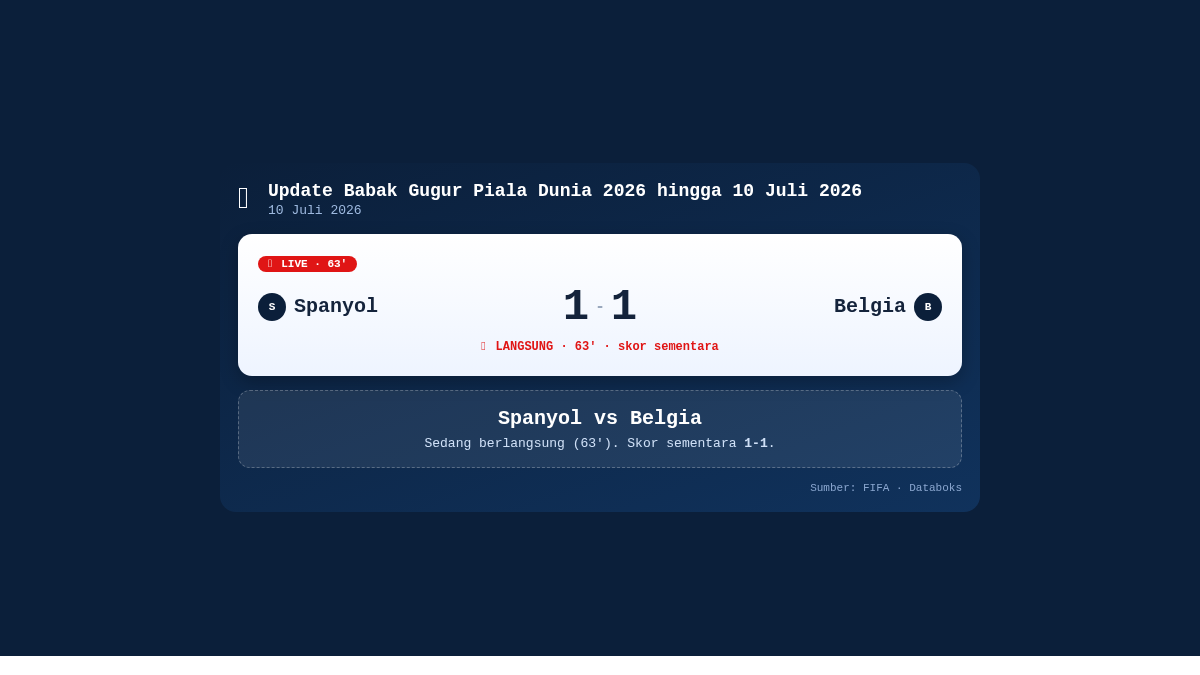
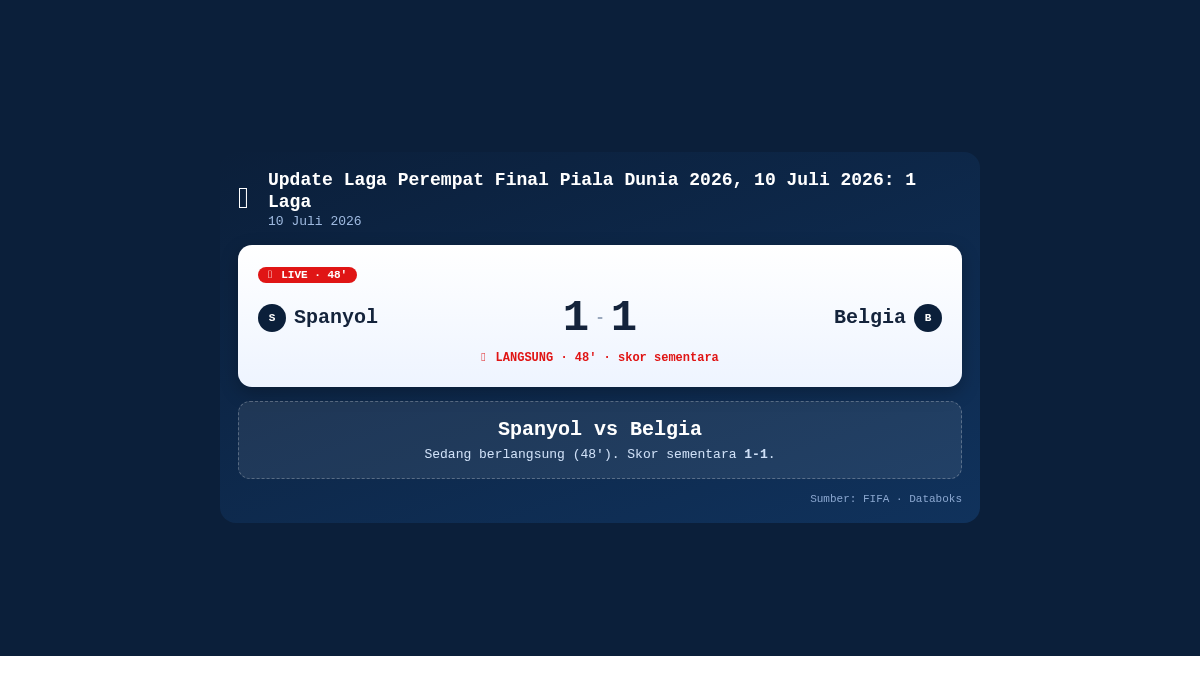
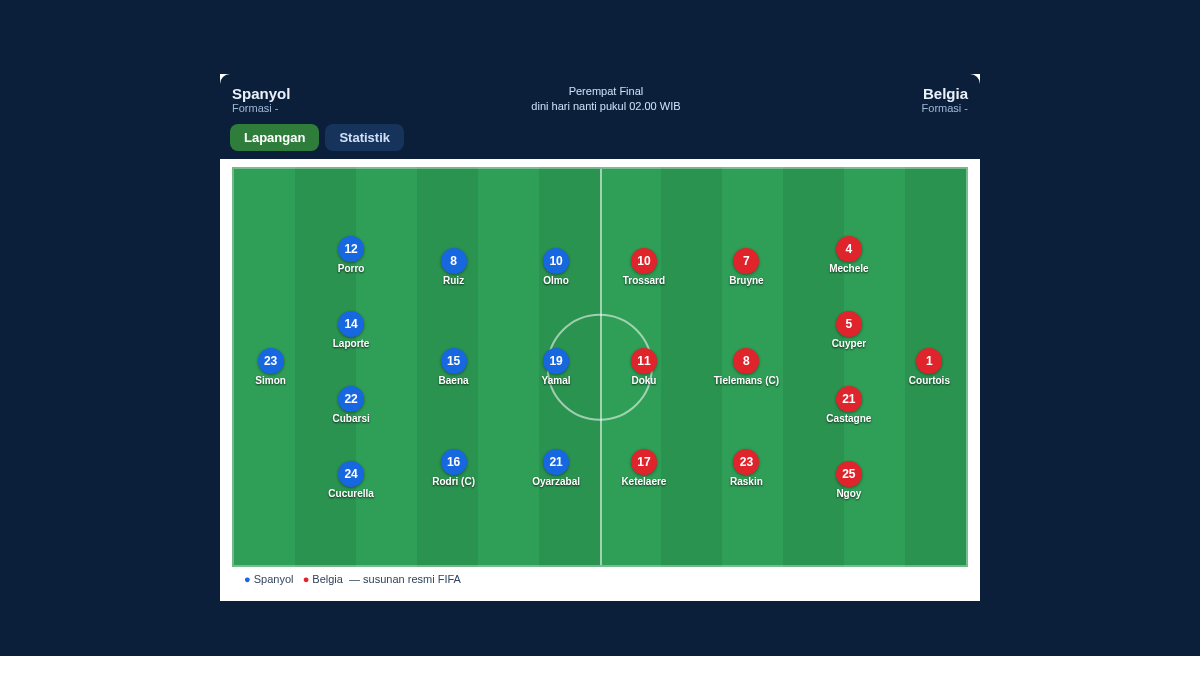
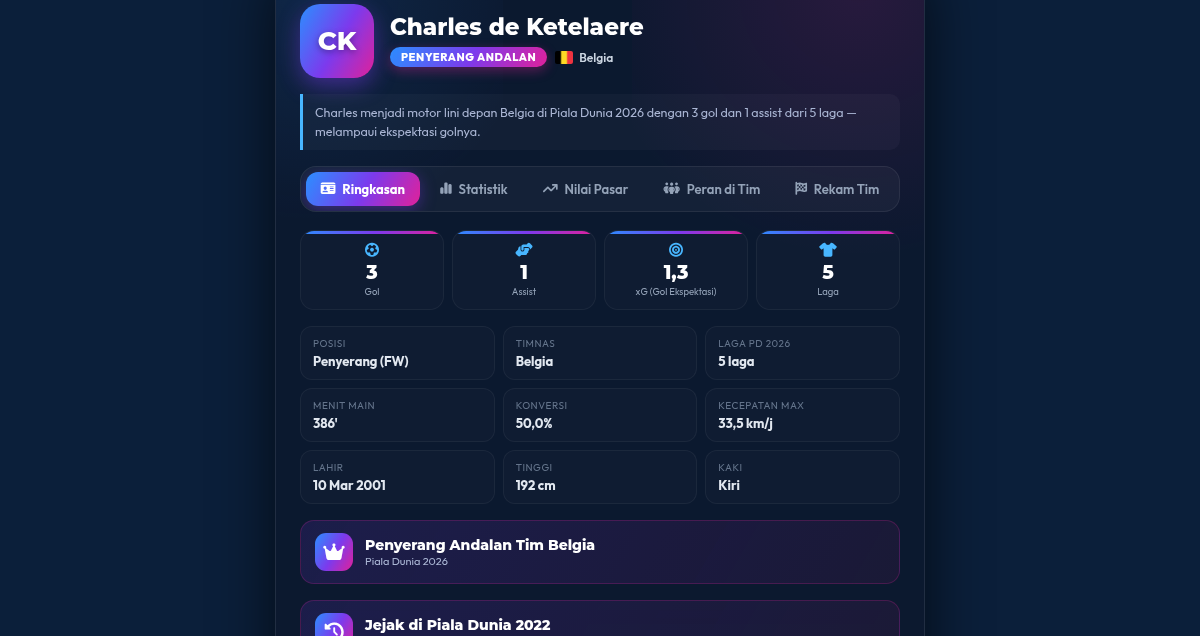
Prevalence of Inadequate Food Consumption in West Nias Dropped 0.39% Over the Past Year


- A Small
- A Medium
- A Bigger
According to Statistics Indonesia (BPS) data, the Prevalence of Undernourishment (PoU) in West Nias Regency, North Sumatra stood at 6.57% in 2025.
This figure decreased by 0.39% from the previous year's 6.96%, and has dropped 2.5% over the last 5 years.
Indonesia's national average PoU was 7.89% in 2025, meaning West Nias Regency has a lower PoU than the national average.
The National Food Agency (Bapanas) defines PoU as a condition where a person regularly consumes insufficient food to meet energy requirements for normal, active, healthy living.
This indicator measures food and nutrition insecurity status.
This means less than 6.57% of West Nias Regency residents do not consume enough dietary energy.
Among 32 districts/cities in North Sumatra, West Nias ranks 21st for PoU. Lowest PoU: Padang Lawas Regency (4.69%); highest: South Nias Regency (9.53%).
Top 10 lowest PoU districts/cities in North Sumatra 2025:
- Padang Lawas Regency: 4.69%
- Karo Regency: 4.7%
- Samosir Regency: 4.96%
- Humbang Hasundutan Regency: 5.22%
- North Padang Lawas Regency: 5.55%
- Central Tapanuli Regency: 5.62%
- Nias Regency: 5.65%
- South Labuhan Batu Regency: 5.65%
- Pakpak Bharat Regency: 5.71%
- Toba Samosir Regency: 5.71%
(Read: Difference in Indonesia Poor Population Count: World Bank vs BPS Version)
"Disclosure: This is an AI-generated translation of the original article. We strive for accuracy, but please note that automated translations may contain errors or slight inconsistencies."
Related Data


Latest Data Stories


Market Data
| Name | Value | % | |
|---|---|---|---|
| Inflasi yoy (Jun) | 3,34% | +0.26 | |
| Inflasi mom (Jun) | 0,44% | +0.16 | |
| Economic growth | 5,11% | +0.08 | |
| Pertumbuhan ekonomi (yoy) (Q1) | 5,61% | +4.08 | |
| Persentase kemiskinan (Des) | 7,50% | -0.75 | |
| Gini rasio (Sem2) | 0,38 | 0.00 | |
| Nilai Tukar USDIDR | 18.059 | -0.09 | |
| PDB ADHK (Q1) | 3.447,70 | -0.77 | |
| Ekspor Migas (Mei) | 758,10 | -34.38 | |
| Neraca perdagangan (Mei) | -1,61 | -1,907.18 | |
| Impor Migas (Mei) | 4,51 | -1.82 | |
| Ekspor (Mei) | 23,20 | -8.30 | |
| Impor (Mei) | 24,81 | -1.59 | |
| Kunjungan Wisman (Mei) | 1,38 | +10.69 | |
| NTP (Jun) | 114,65 | +0.76 |
Trending Topics
Popular Data
