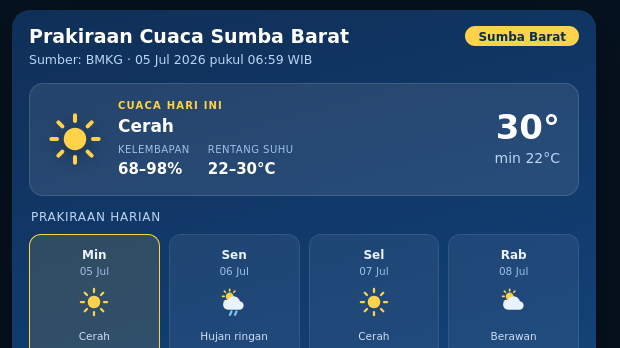
The number of workers in West Sumba Regency has shown a downward trend over the past 14 years. In 2021, the number of workers was recorded at 65,567, and in 2023, it increased to 78,898.
This data on the working population is derived from the annual Sakernas survey conducted by the Central Bureau of Statistics (BPS). The definition of a working person in the Sakernas survey method is as follows: A working person is defined as someone aged 15 years and older.
A working person is defined as someone who performs work with the intention of earning or helping to earn income or profit for at least one hour in the last week. This one-hour work must be consecutive and uninterrupted.
Meanwhile, according to BPS records, the open unemployment rate (TPT) in West Sumba Regency in December 2023 increased by 0.54% to 3.52% compared to December 2022. Over the past six years, the open unemployment rate (TPT) has shown a downward trend, continuing the previous year's declining trend.
The open unemployment rate (TPT) by regency/city is raw data sourced from BPS. The data is produced annually in percentage units. This data is available for the period 2018-2023.
nama_kab
The increase in the open unemployment rate (TPT) is inseparable from the data on the number of the workforce in this region. The number of the workforce in West Sumba Regency has shown a downward trend over the past 16 years. In 2021, the number of the workforce was recorded at 66,729, and in 2023, it increased to 81,775.
Compared to other regencies/cities, the open unemployment rate in this regency/city ranks 305 nationally. The national average open unemployment rate in 2023 was 4.3%.
The increase in the open unemployment rate (TPT) in West Sumba Regency is not directly related to economic growth in the region, which also continues to increase in 2023. The economy in this region in 2023 was recorded at 3.7 percent. Previously, in 2022, economic growth in this regency/city was recorded at 3.23 percent.
Population Data in West Sumba Regency:
The population of West Sumba Regency is recorded at 141,780 as of 2024. This figure shows a decrease. Compared to the previous five years, the Compound Annual Growth Rate (CAGR) of this region is recorded as higher. The growth over the last five years is recorded at 1.8%.
Compared to other regencies/cities in East Nusa Tenggara Province, the population of West Sumba Regency ranks 20th, while by island, this regency/city ranks 39th.
The majority of the population in this region, or about 64.48%, are of working age (15-59 years), totaling 91,428. According to a 2024 BPS publication, the number reached 91,428. The remaining population consists of approximately 27.25% aged 0-14 years (children) and 8.26% aged 60 years and older.
The following is the population by age in West Sumba Regency in June 2024, sourced from a BPS publication:
- Age 0-4 years: 10,590 (7.47%)
- Age 5-9 years: 13,950 (9.84%)
- Age 10-14 years: 14,100 (9.94%)
- Age 15-19 years: 16,430 (11.59%)
- Age 20-24 years: 15,520 (10.95%)
- Age 25-29 years: 12,710 (8.96%)
- Age 30-34 years: 9,910 (6.99%)
- Age 35-39 years: 9,670 (6.82%)
- Age 40-44 years: 8,350 (5.89%)
- Age 45-49 years: 7,480 (5.27%)
- Age 50-54 years: 6,330 (4.46%)
- Age 55-59 years: 5,040 (3.55%)
- Age 60-64 years: 3,950 (2.79%)
- Age 65-69 years: 2,940 (2.07%)
- Age 70-74 years: 2,080 (1.47%)
- Age 75 years and older: 2,750 (1.94%)